
Saqib Hanif is the founder of Calculator Value and an SEO-focused website builder. His work centers on technical SEO, on-page optimization, content structure, internal linking, and search-driven publishing, supported by practical implementation skills when needed. Read full profile
The Square Root Curve Calculator provides accurate conversions between Percentage Grades and Square Root Curve Grades. The calculations follow these formulas:
Square Root Curve Grade = √(Percentage Grade) × 10Percentage Grade = (Square Root Curve Grade ÷ 10)²For example:
49, the Square Root Curve Grade is: √49 × 10 = 7 × 10 = 7070, the Percentage Grade is: (70 ÷ 10)² = 7² = 49This ensures reliable and consistent results for both types of grades.
In the education system, the grading curve is a sometimes used method that helps to adjust students' scores. We will explain the Square Root Curve grading method which is used in the grading system.
This method allows us to adjust the scores of the poorly performing students while ensuring that the higher scores increase at a slow rate. In this post, we will explore its formula, definition, and real-world example.
This calculator is very simple and uses general concepts. however, it is intended for informational purposes only. Keep in mind that rules and policies may vary by schools, colleges, and education departments.
The Square Root Curve is a grading method that helps students balance difficulty and fairness. This concept is mainly used when an assignment or exam is tough; it ensures that students who performed poorly still receive a reasonable grade improvement.
Dive deep to discover the formula and a real-world example.
In simple words, the square root curve is used to adjust student scores when a test is unusually difficult or outside the expected course level. In this method, each test score is square-rooted and then scaled. It boosts lower scores while giving smaller increases to higher scores, effectively benefiting the lower score students while compressing the higher score.
The square root curve works by applying the square root operation to the input score. We will need the following formula in order to precisely calculate the Square Root Curve:
Formula:
Square Root Curve Grade = √(Percentage Grade) × 10
If you want to reverse the process to get the original percentage grade, you just need to use this formula
Percentage Grade = (Square Root Curve Grade / 10)²
For example, a class was given an out-of-course test, so the teacher wanted to make the test scores fairer. Here is how it works:
First, take the square root of each student’s score, e.g., if a student’s score is 60, applying the square root gives √60 = 7.74.
Next, simply multiply that square-root result by 10 to keep the score in the range of 0 to 100, e.g., 7.74 × 10 = 77.4.
So, a student score of 60 is scaled and becomes 77.4, mainly helping lower-scoring students, while it is less beneficial as scores are higher.
Using our calculator is fairly simple. There are only two inputs — you can fill in either one, and the other will automatically show the calculated value.
Let's assume you have put a value of 49 inside the Percentage Grade input; the Square Root Curve Grade input will instantly show a value of 70. That's simple, if you are still not sure, follow this set of instructions:
That’s how simple our square root curve calculator is — keep reading to learn more about the formula, real-world example, and much more.
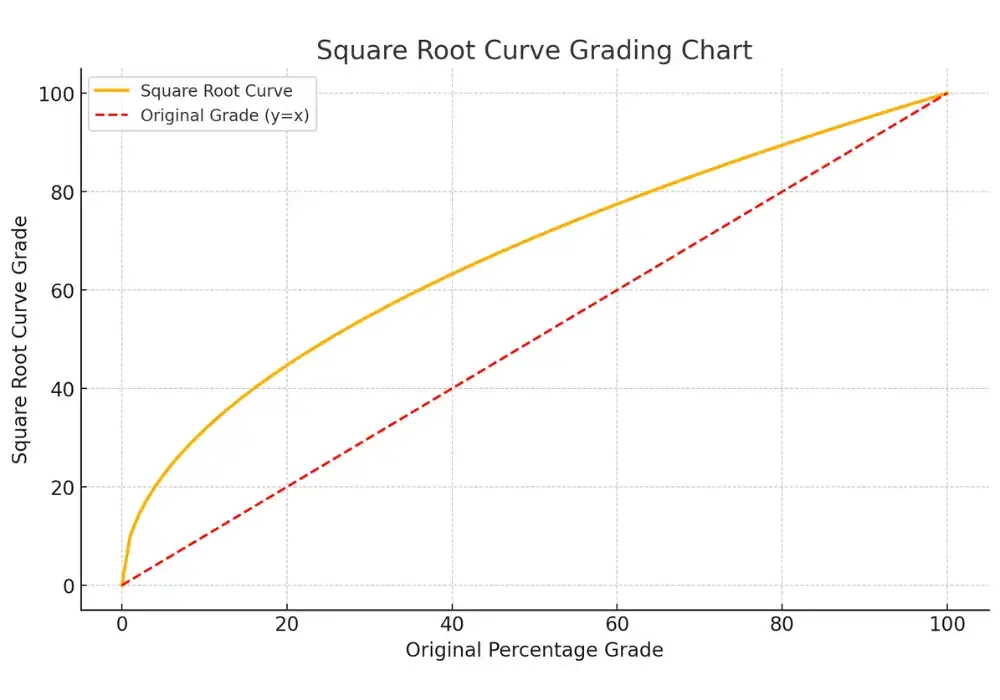
Below, we have prepared a visual representation of the Square Root Curve chart image:
Let's look at an example to understand the square root curve concept deeply.
Example:
Suppose a student's score is 65% in an exam; let's compute using the formula:
Thus, after using the square root curve the student now gets a new grade which is 80.6%.
This concept is widely used in various grading systems; the following are some real-world applications.
We have built a table that showing calculated sqrt curve ranging from 0 to 100 values. Let's see in the table below:
| Raw Grade | Curved Grade | Formula Used |
|---|---|---|
| 40 | 63.25 | √40 × 10 |
| 50 | 70.71 | √50 × 10 |
| 60 | 77.46 | √60 × 10 |
| 70 | 83.66 | √70 × 10 |
| 80 | 89.44 | √80 × 10 |
| 90 | 94.87 | √90 × 10 |
The main purpose of the Square Root Curve is to fairly adjust students' grades in cases where an exam or assignment is particularly tough; it benefits students with lower scores by increasing their grades proportionally, making grading more balanced.
No, it benefits lower-scoring students more than higher-scoring students. The reason for this is that the square root transformation is non-linear, meaning that the students with lower scores experience a greater proportional increase.
You can use the following formula in Excel or spreadsheet to get the Square Root Curve:
=SQRT(A1)*10
Cells A1 and B1 contain the headings Percentage Grade and Square Root Curve Grade, respectively.
So, paste this formula in cell B2, where A2 contains the raw percentage grade. The adjusted curved score will appear in B2.
| Percentage Grade | Square Root Curve Grade |
|---|---|
| Raw percentage grade e.g., 64 | =SQRT(A2)*10 |
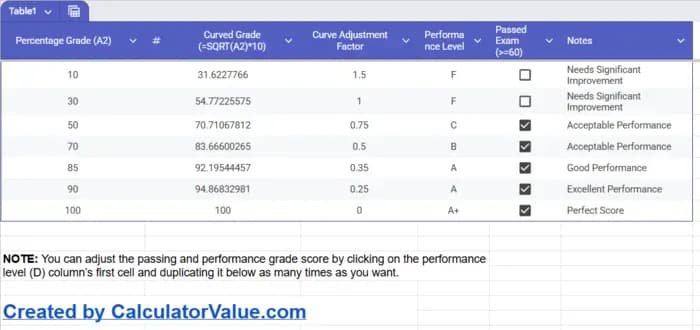
We have prepared a ready-to-use spreadsheet Square Root Curve calculator that you can "Make a copy" and use. Here is a link to the spreadsheet calculator template.
In a square root curve, the square root function is applied to the student's raw percentage score, which is then multiplied by 10. It benefits students with lower scores by increasing their smaller numbers significantly, while larger numbers get smaller increments, meaning lower benefits.
Let's consider this example:
Assume a student's score is 64%.
The adjusted curve grade is 80%.
Yes, the square root curve is considered an optimum method when the exam is too tough or the students’ overall performance is unexpectedly low, depending on the instructor’s intent, the exam, and institutional rules.
This method ensures that: